Learn how to query large datasets from the IMF’s PortWatch platform using R and the ArcGIS REST API. This tutorial was developed with members of the IMF’s PortWatch team Mario Saraiva and Alessandra Sozzi.
Setup
Start by loading the required packages:
library(httr)library(jsonlite)library(dplyr)
Attaching package: 'dplyr'
The following objects are masked from 'package:stats':

    filter, lag
The following objects are masked from 'package:base':

    intersect, setdiff, setequal, union
library(glue)library(data.table)
Attaching package: 'data.table'
The following objects are masked from 'package:dplyr':

    between, first, last
Define Available Datasets
PortWatch datasets are hosted on ArcGIS Online. Each dataset has a unique service name. It is important to explore and specify the datasets to query. In our case, we will use PortWatch’s Daily_Trade_Data (ports) and Daily_Chokepoints_Data (key maritime passages).
Each dataset has a unique name that is inserted into a standard REST API URL structure. Instead of hardcoding URLs, we define a flexible function that takes a dataset name and returns the corresponding API endpoint.
# Function to compose dataset URLget_api_url <-function(dataset) { base <-glue("https://services9.arcgis.com/weJ1QsnbMYJlCHdG/ArcGIS/rest/services/{dataset}/FeatureServer/0/query")return(base)}
For example, if I wanted to retrieve the URL for the Daily Trade Data, I would do it in the following manner:
ArcGIS services can contain one or more tables of data. When a service contains only a single table, the query endpoint can be constructed directly using the service name, as we did earlier with the chokepoints dataset.
The Daily Ports dataset, however, is organized slightly differently. The service contains a table where the actual port data is stored, and queries must be directed to that table specifically. In this case the relevant table is table 0, which is why the query URL ends with /FeatureServer/0/query.
# Convert the ports dataset name into the correct query endpointports.url <-paste0("https://services9.arcgis.com/weJ1QsnbMYJlCHdG/ArcGIS/rest/services/", ports.url,"/FeatureServer/0/query")
Define API Query Helpers
To retrieve data from the ArcGIS API, we make repeated GET requests with specific query parameters (like filters and output fields). Instead of repeating the same request logic multiple times, we define a wrapper function around httr::GET() that sends the request and parses the response into a JSON object.
This function simplifies the rest of our workflow by abstracting away the raw HTTP logic:
# Function to make API requests and increment resultOffsetget_api_data <-function(url, params) { response <-GET(url, query = params) response1 <-fromJSON(rawToChar(response$content))return(response1)}
This helper allows us to pass any combination of where, outFields, and parameters to the API and return a result ready for processing.
Creating query_portwatch()
Given the millions of records in ArcGIS Feature Servie, we build a core function that handles large-scale data extraction from Portwatch, the query_portwatch() function. This handles data extraction in three main steps:
It first queries the API to get the total number of available records.
Then, it loops through the data in batches (up to 5,000 records at a time), appending each batch to a unified result.
Lastly, it returns a cleaned data.table with parsed date values.
# Function to query PortWatch dataquery_portwatch <-function(url, where ="1=1", maxRecordCountFactor =5, outFields ="*") { batch_size <- maxRecordCountFactor *1000# Step 1: Get total record count params_initial <-list(where = where, returnCountOnly =TRUE, f ="json") total_records <-GET(url, query = params_initial) %>%content("parsed") %>% .$countprint(paste0("Begin extraction of ", total_records, " records..."))# Prepare to store results all_results <-list() params_query <-list(where = where, outFields = outFields, f ="json", maxRecordCountFactor = maxRecordCountFactor)# Step 2: Batch fetchfor (offset inseq(0, total_records, by = batch_size)) {print(paste0("Extracting batch from record ", offset, "...")) params_query$resultOffset <- offset result <-get_api_data(url, params_query)print('Length of result$features:')print(length(result$features))if (length(result$features) >0) { df_batch <-as.data.frame(result$features$attributes) all_results[[length(all_results) +1]] <- df_batch } else {break }Sys.sleep(1) } final_df <-rbindlist(all_results, fill =TRUE)if ("date"%in%colnames(final_df)) {if (is.numeric(final_df$date)) { final_df$date <-as.POSIXct(final_df$date /1000, origin ="1970-01-01", tz ="UTC") } else { final_df$date <-as.POSIXct(final_df$date, tz ="UTC") } final_df <- final_df %>%arrange(date)}return(final_df)}
You can now use this function to extract data from any PortWatch-compatible ArcGIS service with just a few lines of code.
Query Examples
We will now show you how to use query_portwatch() with real-world filters to retrieve data from the PortWatch API. Each example corresponds to a typical use case: chokepoint activity, individual port traffic, or country-level trade data.
Query a Chokepoint (e.g., Suez Canal)
The Daily_Chokepoints_Data dataset includes maritime chokepoints such as the Suez Canal. You can query by portid, using values like 'chokepoint1', 'chokepoint2', etc. This will return daily vessel activity and trade volume passing through the Suez Canal.
You can target a specific commercial port using the Daily_Trade_Data dataset. Each port has a unique portid identifier — in this case, 'port1114' for Rotterdam. This will return time series data for vessel calls, imports, and exports for Rotterdam.
# 2. Query Rotterdam port (port1114)port1114 <-query_portwatch(url = ports.url,where ="portid='port1114'")
[1] "Begin extraction of 2615 records..."
[1] "Extracting batch from record 0..."
[1] "Length of result$features:"
[1] 1
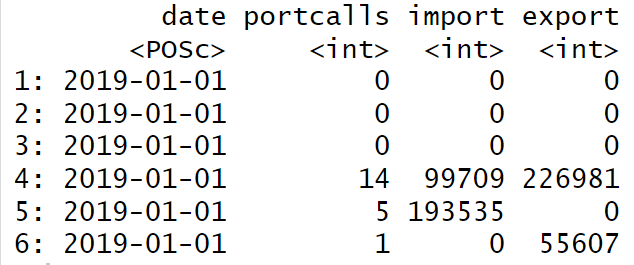
You can extract trade data for all ports in a specific country using the ISO3 country code (e.g., "USA" for the United States). To keep results focused, this example limits the output to four key fields. This will return daily totals of port calls, imports, and exports across U.S. ports.
# 3. Query all ports in the USA with select fieldsus_ports <-query_portwatch(url =ports.url,outFields ="date,portcalls,import,export",where ="ISO3='USA'")head(us_ports)
Creating your own filters with field names
To customize your queries, it’s helpful to inspect the available field names for the dataset. This ensures your where clauses match real column names.
#Inspect available fields to construct your own filtersmeta_url <-"https://services9.arcgis.com/weJ1QsnbMYJlCHdG/ArcGIS/rest/services/Daily_Ports_Data/FeatureServer/0?f=json"meta_resp <-GET(meta_url)fields <-fromJSON(content(meta_resp, as ="text", encoding ="UTF-8"))# List available field namesfield_names <- fields$fields$nameprint(field_names)
Here are a few filter examples you can plug into your query_portwatch() call:
where ="country = 'China'"# Filter by country namewhere ="portid = 'port1207'"# Filter by specific portwhere ="ISO3 = 'BRA'"# Filter by ISO3 country codewhere ="portcalls > 10"# Filter by numeric thresholdwhere ="year = 2024 AND ISO3 = 'IND'"# Combine conditions
You’re now ready to create your own custom queries in PortWatch.