install.packages("ragg")}Fonts and Font Families
Introduction
In this tutorial, we’ll explore how to use custom fonts in R graphics with the ragg library.
Prerequisites
Before we begin, make sure you have the ragglibrary installed. You can install it using the following command if you haven’t already:
Next, load the library:
library(ragg)Use ragg in RStudio
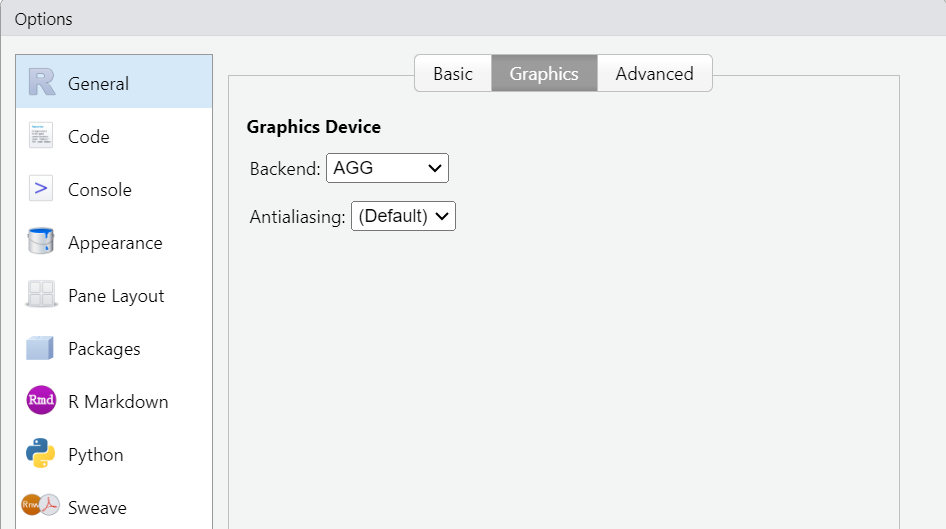
To use ragg in RStudio, choose AGG as the backend in the graphics pane. In the menu, go to Tools, Global Options, choose Graphics and then select the backend to AGG

Ragg and system fonts
Ragg has direct access to system fonts. Fonts that are installed on your computer can automatically be used. No need to load fonts first (as is needed in other libraries such as extrafont or showtextdb).
Now let’s create plots using several fonts and demonstrate how to adjust font size, style, and weight.
Using “Segoe UI” Font
# Create a plot with the "Segoe UI" font
# Increase the margin for the left side to provide space for the y-axis label
par(mar = c(5, 5, 4, 6))  # Adjust the margin values as needed

# Create a plot with the "Segoe UI" font
plot(1:10, main = "Segoe UI Font Example", xlab = "X-axis", ylab = "Y-axis",
     family = "Segoe UI",las=1)
Using “Arial” Font
# Create a plot with the "Segoe UI" font
# Increase the margin for the left side to provide space for the y-axis label
par(mar = c(5, 5, 4, 6))  # Adjust the margin values as needed

# Create a plot with the "Segoe UI" font
plot(1:10, main = "Arial Font Example", xlab = "X-axis", ylab = "Y-axis",
     family = "Arial",las=1)
Font Styles in R
In base R, when setting font styles for text in plots, the font argument takes integers that specify the style of the font to be used:
1for plain text (normal)2for bold text3for italic text4for bold and italic text
Example usage in a plot:
plot(1, 1, xlab="", ylab="", xaxt='n', yaxt='n', bty='n', pch="") # create a blank plot

text(1, 1, "Normal Text", font=1)
text(1, 0.8, "Bold Text", font=2)
text(1, 0.6, "Italic Text", font=3)
text(1, 0.4, "Bold Italic Text", font=4)
How to make sure the chart title is not bold
In base R, the title is normally made bold. If we want to make it normal, we need to plot the title separately and set font.main=1.
# Create a plot with the "Arial" font with unbolded title
# Increase the margin for the left side to provide space for the y-axis label
par(mar = c(5, 5, 4, 6))  # Adjust the margin values as needed

# Create a plot with the "Segoe UI" font
plot(1:10,  xlab = "X-axis", ylab = "Y-axis",
     family = "Arial",las=1)
title("Arial font example where title is not bold", font.main=1)
Watch out for missing font faces
Most fonts have a normal, bold and italic font face. But some fonts don’t. If you use such a font, the results may be unexpected.
Using “Lucida Handwriting” Font
If you use “Lucida Handwriting” you would expect that all fonts show up as Lucida Handwriting.
# Create a plot with the "Lucida Handwriting" font

par(mar = c(5, 5, 4, 6))  # Adjust the margin values as needed

plot(1:10,  xlab = "X-axis", ylab = "Y-axis",
     family = "Lucida Handwriting", las=1)
title(main = "Main title", family="Lucida Handwriting")
However, that is not the case. The title is in a different font. Why is that?
Lucida Handwriting only has a normal font face. As the title of a chart by default is made in bold, it cannot find the font, and therefore substitutes a different font.
The solution is to set the font face to 1 (which is normal). If you do that the plot will show up as expected:
# Create a plot with the "Lucida Handwriting" font

par(mar = c(5, 5, 4, 6))  # Adjust the margin values as needed

plot(1:10,  xlab = "X-axis", ylab = "Y-axis",
     family = "Lucida Handwriting", las=1)
title(main = "Main title", family="Lucida Handwriting", font.main=1)
Using several fonts.
We can also combine several fonts. In this example we use Lucida Handwriting for the main chart and Segoe UI for the title.
# Create a plot with the "Lucida Handwriting" font

par(mar = c(5, 5, 4, 6))  # Adjust the margin values as needed

plot(1:10, main = "", xlab = "X-axis", ylab = "Y-axis",
     family = "Lucida Handwriting", las=1)
# Modify the size of the main title
title(main = "Customized Main Title (Larger and different font)", cex.main = 1.5, family="Segoe UI")